
Your fan is whirring like a turbine and your PC case is getting so hot it’s causing you concern. Before you download the first diagnostic tool you find on Google, your machine already has the answers. The temperature sensors on your motherboard monitor the heat of your components in real time. You just need to know where to find them.
In this article
Why monitor your PC’s temperature?
When a processor or graphics card reaches its thermal limit, it automatically reduces its clock speed to protect itself. This is known as throttling. As a result, the PC slows down, games become choppy, and rendering takes three times as long.
In the long run, high temperatures cause thermal paste to degrade more quickly, dry out capacitors and wear out fans. Cleaning or replacing the thermal paste costs far less than a burnt-out motherboard.
Temperature guidelines for common components:
| Component | At rest | Under load | Critical zone |
|---|---|---|---|
| Processor (CPU) | 35 to 55 °C | 70 to 90 °C | > 95 °C |
| Graphics card (GPU) | 40 to 60 °C | 70 to 90 °C | > 95 °C |
| Motherboard (chipset) | 30 to 50 °C | 60 to 70 °C | > 70 °C |
| SSD (NVMe) | 30 to 50 °C | 70 to 80 °C | > 80 °C |
| Hard disk drive (HDD) | 25 to 40 °C | 50 to 60 °C | > 70 °C |
For gaming laptops, it is not unusual for CPUs to exceed 90 °C under load. Manufacturers design the thermal system with these temperatures in mind. This is different from a desktop PC, which should remain below 80 °C during intensive use.
1. Read the motherboard’s temperature sensors using PowerShell
The motherboard coordinates all the components of the PC. It manages data flow, power supply and communication between each component. When it overheats, the system’s thermal balance is compromised and performance drops. Persistent heat at this level eventually leads to system reboots or premature wear and tear on the circuits.
Windows includes PowerShell, a tool capable of querying internal sensors directly via WMI (Windows Management Instrumentation). With just a few command-line instructions, it displays the temperature recorded by the motherboard’s sensors.
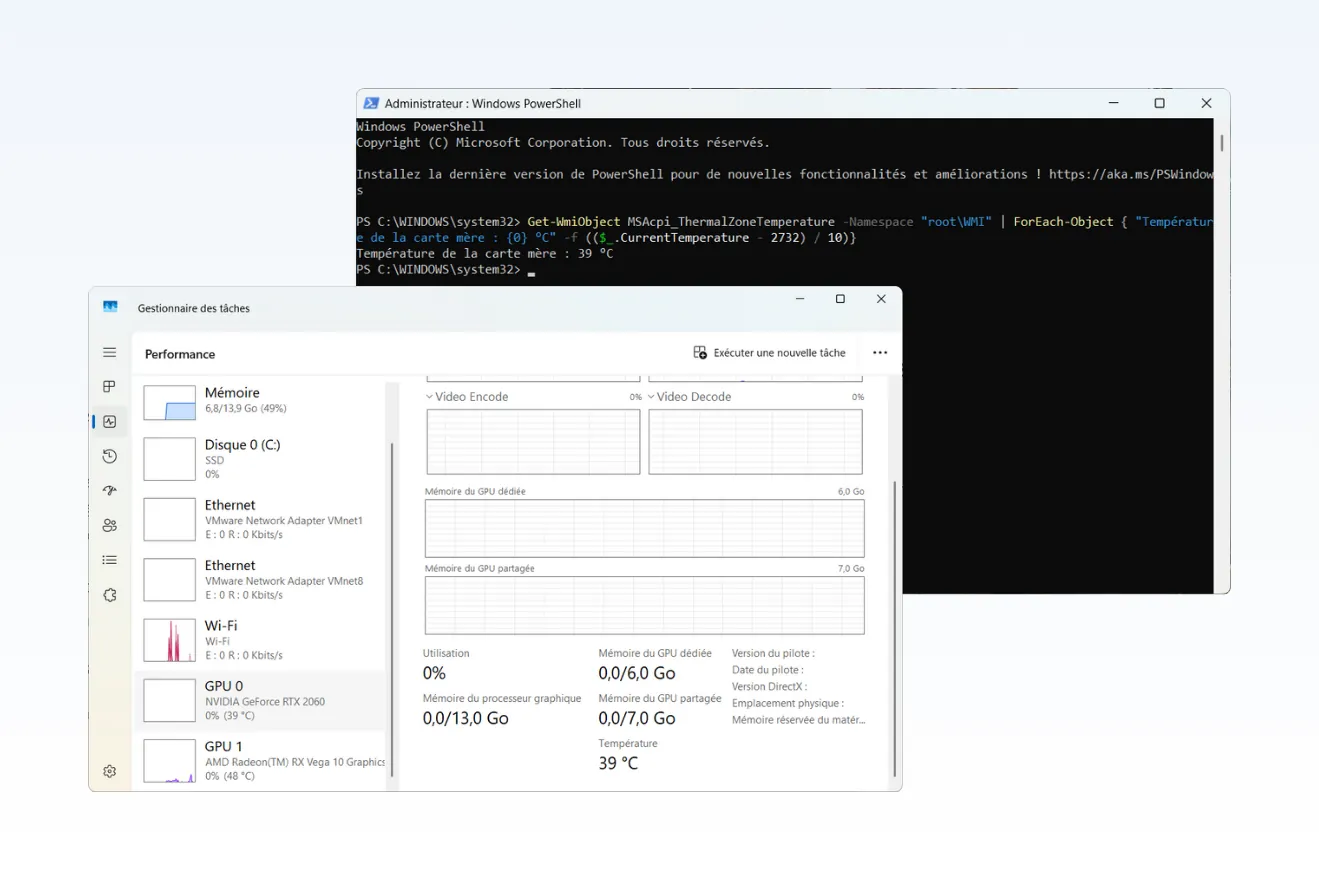
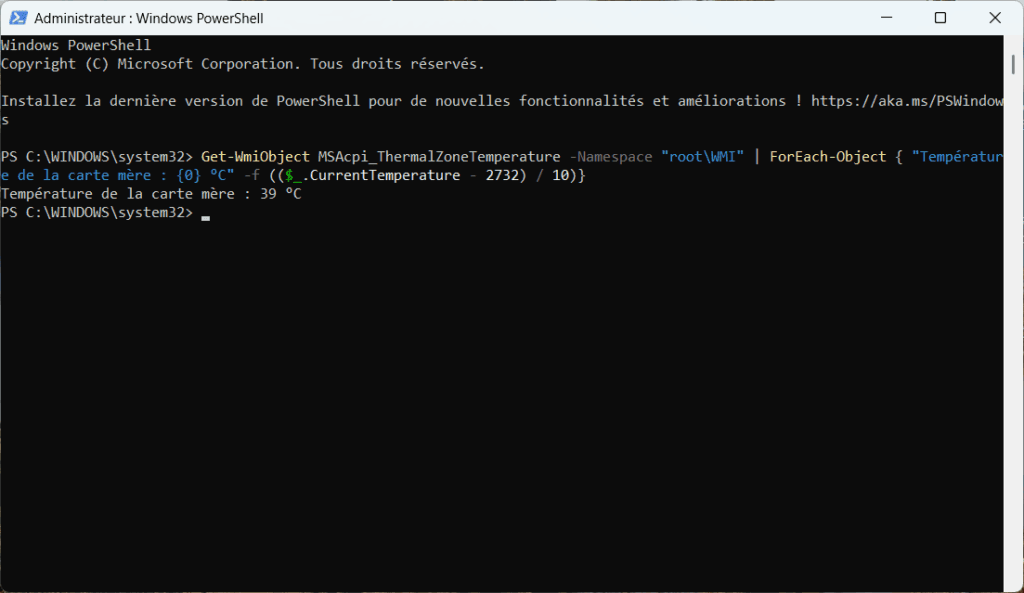
Open PowerShell as an administrator and enter:
Get-WmiObject MSAcpi_ThermalZoneTemperature -Namespace "rootWMI" | ForEach-Object { "Motherboard temperature: {0} °C" -f (($_.CurrentTemperature - 2732) / 10)}
The value is displayed in degrees Celsius following automatic conversion from the kelvins used by the system.
Important limitation: PowerShell does not read the CPU temperature. It reads the motherboard’s thermal sensors, located near the chipset. The difference can be as much as 10 to 15 °C compared to the processor. For core-by-core CPU temperature, only dedicated software (Core Temp, HWiNFO) can access the processor’s internal registers.
If the command returns an error, your motherboard is not sending its data to WMI. This is normal on some models; it is not a fault.
2. Check the GPU temperature in Task Manager
Windows Task Manager displays the graphics card temperature without needing to install anything. Open it using Ctrl + Shift + Esc, go to the Performance tab, and click on GPU in the left-hand column. The temperature is displayed in the bottom-right corner of the window.
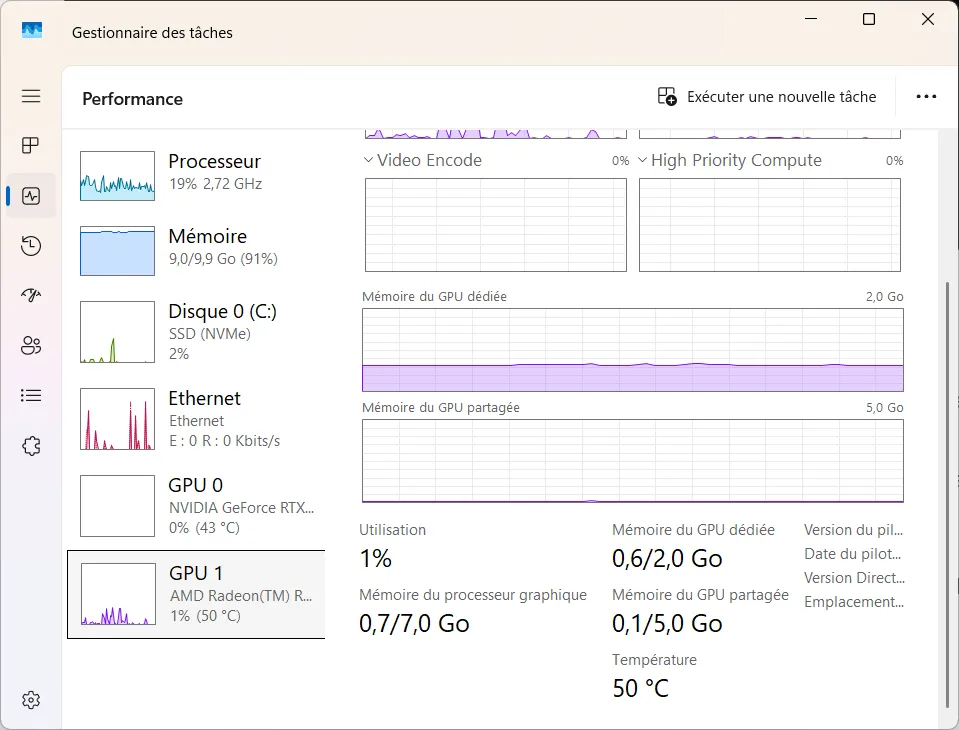
This method only displays the GPU. The CPU does not appear. On some systems with multiple GPUs, only the first one is shown. If the GPU temperature does not appear at all, the graphics driver is not sending the information to Windows. Update the driver or use dedicated software.
3. Checking component temperatures via the BIOS/UEFI
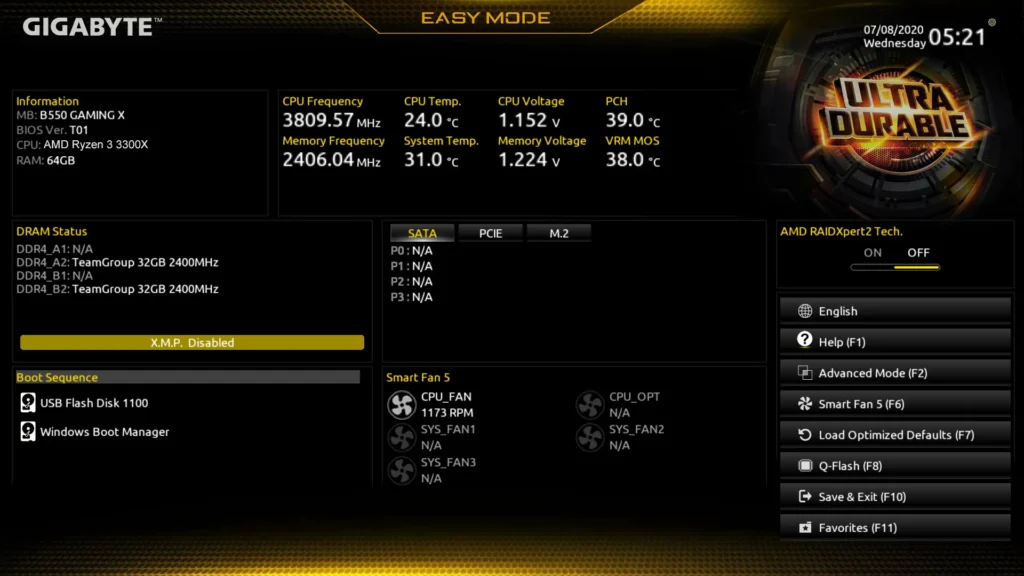
The BIOS, or its modern equivalent UEFI, runs as soon as the computer is switched on. It initialises the hardware even before Windows loads. It is one of the few environments that displays the internal temperatures measured by the motherboard and the processor directly, without the need for any software.
To access this, restart your computer and press the BIOS key for your motherboard (usually Del, F2 or F10). The interface displays the temperatures of the processor and motherboard, as well as the fan speeds.
This method requires you to restart the PC. The readings reflect the system’s idle state. They are therefore lower than what you would observe whilst gaming or rendering. This is a good way to check that the cooling system is working when the system is cold, but not for diagnosing overheating whilst the system is in use.
An unusually high temperature at this stage, even when the system is idle, indicates a faulty fan, dried-out thermal paste or insufficient airflow within the case.
These methods are less reliable than dedicated software
PowerShell reads the motherboard sensors. Task Manager displays the GPU temperature. The BIOS provides a direct reading of the physical sensors before Windows starts up. These three tools are sufficient for a quick check, to verify that the cooling system is running or to detect any obvious overheating.
To monitor temperatures in real time during a gaming session or video rendering, or to view CPU temperatures on a per-core basis, you’ll need software. Our round-up of the best free PC temperature monitoring software highlights the five most reliable options for Windows 11.
If temperatures remain abnormally high despite cleaning, the fan may be clogged with dust or nearing the end of its service life. In this case, having the fan replaced at a computer repair shop will restore proper cooling and protect your components at the same time.