
During a gaming session or video rendering, you may want to see your CPU and GPU temperatures in real time. Windows does not display processor temperature natively. You need dedicated software. Here are the best tools tested on Windows 11.
In this article
What are normal PC temperatures?
These values vary depending on the type of PC (desktop or laptop), the cooling system and the age of the hardware. A gaming laptop may exceed 90 °C under load without this being abnormal if the manufacturer designed its thermal system accordingly.
| Component | Idle | Under load | Alert threshold |
|---|---|---|---|
| CPU (desktop) | 35 à 50 °C | 70 à 85 °C | > 95 °C |
| CPU (gaming laptop) | 40 à 55 °C | 80 à 95 °C | > 100 °C |
| GPU | 40 à 60 °C | 70 à 90 °C | > 95 °C |
| SSD NVMe | 30 à 50 °C | 60 à 80 °C | > 85 °C |
| HDD | 25 à 40 °C | 45 à 55 °C | > 60 °C |
If temperatures remain within these ranges, the cooling system is working correctly. If they regularly exceed the alert thresholds, start by cleaning the fans and checking the thermal paste before buying new hardware. Find out when to change the thermal paste and which signs to look for.
1. HWMonitor to monitor every component
HWMonitor, developed by CPUID, is ideal for users who want a clear overview without HWiNFO’s dense interface. It displays CPU, GPU, motherboard and drive temperatures in an easy-to-read tree. For each sensor, three columns appear side by side: the minimum value recorded since launch, the current value and the maximum peak. It is the one I prefer and use every day: it is very intuitive, with each component clearly displayed and its temperatures directly visible underneath.
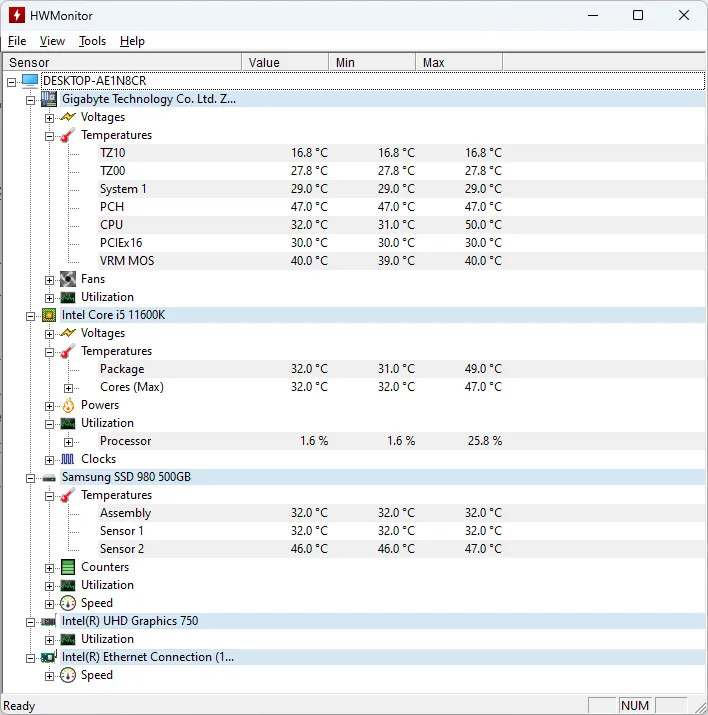
Some motherboards display generic sensors named TMPIN0, TMPIN1 and TMPIN2. These vague names come from the chipset and do not always correspond to an identifiable component.
HWMonitor is also available as a portable version that requires no installation. This is useful for quickly diagnosing a computer from a USB drive without leaving anything behind.
2. OCCT to diagnose overheating under load
OCCT is not a tool for everyday monitoring. It is a stress test that pushes your CPU or GPU to 100% for several minutes and displays temperatures in real time under load. It is the right tool if you want to check how your PC behaves under maximum pressure, not just at idle or during normal browsing.
OCCT offers several types of tests. The CPU OCCT test is the most common way to check the processor’s thermal stability. The GPU 3D test is for the graphics card. The Power Supply test loads the CPU and GPU simultaneously to push the power supply to its limit. For a standard thermal diagnosis, start with the CPU test for 10 minutes. If temperatures level off, the cooling system is holding up. If they keep climbing towards the alert thresholds, there is a problem.
 assistouest.fr
After cleaning the fans, replacing the thermal paste or installing a new CPU cooler, an OCCT test confirms whether the intervention worked. The temperature graphs generated during the test make it possible to compare before and after.
3. HWiNFO64 to analyse your PC temperatures
HWiNFO64 covers the CPU, GPU, motherboard, RAM, power supply and drives. It displays dozens of sensors simultaneously. It is the reference tool for overclockers and technicians because it is not limited to temperatures. Voltages, fan speeds, frequencies and power consumption are all shown in a single window.
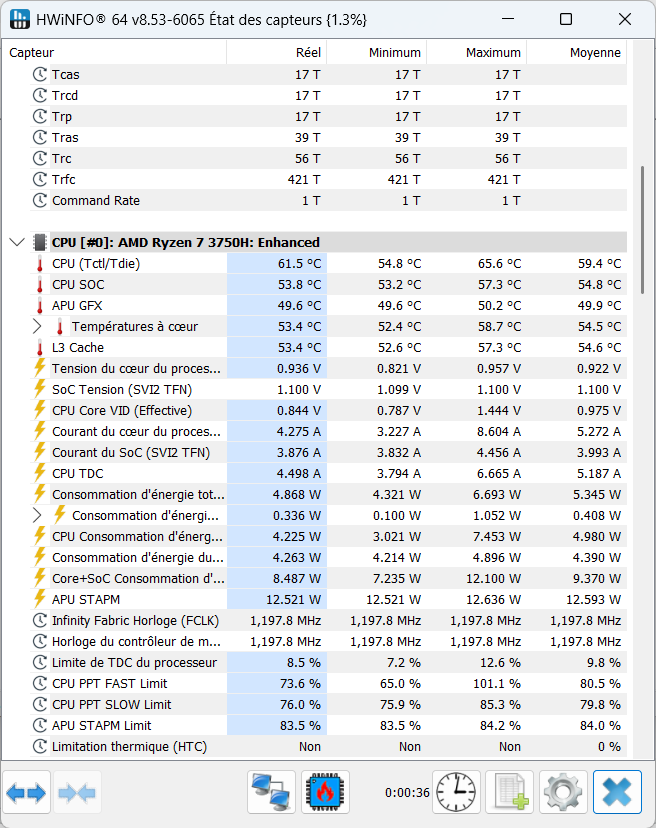
When you launch it, choose Sensors only mode to access the sensors directly without going through the system summary. The interface displays a tree organized by component. If the list is too long, right-click a sensor to hide it or add a threshold alert. HWiNFO64 can also record every value in a CSV file so you can analyse temperatures over an entire session and spot peaks afterwards.
Its interface is dense and is not designed for occasional use. But for a complete diagnosis or an overclocking session, no other free tool offers the same level of detail. It connects to RTSS (RivaTuner Statistics Server) to display data as an in-game overlay and integrates directly with MSI Afterburner to centralize all sensors in a single OSD.
4. Libre Hardware Monitor for software developers
Libre Hardware Monitor has an API in addition to its graphical interface. This is one of its main advantages: it does not just display temperatures, it also lets you connect its sensors to other software.
The project provides LibreHardwareMonitorLib, a .NET library designed to be integrated directly into other software. It provides access to the same sensors as the main application: CPU and GPU temperatures, fans, voltages, frequencies, storage, motherboard and much more. This API is particularly useful for creating a custom dashboard, automating monitoring or integrating hardware data into an existing tool.
5. Speccy to check temperatures quickly
Speccy displays a complete summary of your configuration and all component temperatures within seconds. The interface is organized by category, with CPU, RAM, motherboard, graphics card and storage. Clicking any category opens its details. It is convenient when you want an immediate overview without searching through a tree of dozens of sensors.
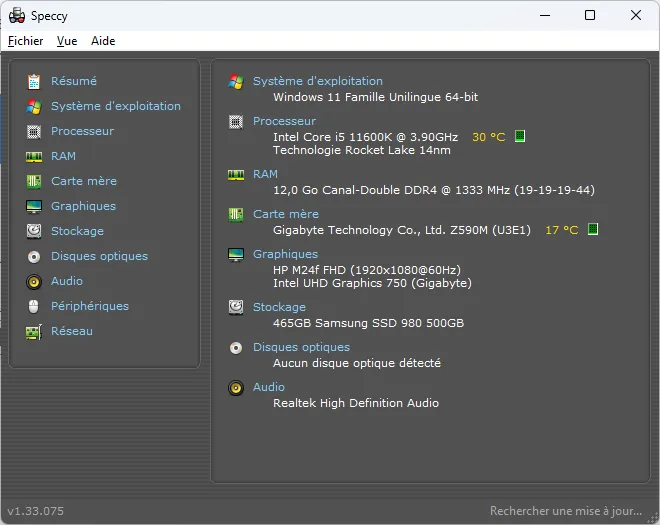
Speccy is no longer actively developed since Piriform was acquired by NortonLifeLock. It works correctly on Windows 11 but no longer receives regular updates. It is sufficient for occasional diagnostics. For continuous monitoring or an in-depth diagnosis, Core Temp or HWiNFO are better choices and are actively maintained.
Don’t let the algorithm decide for you
Add Assistouest to your preferred sources on Google so you can find our guides faster when you search for an IT solution.
Manufacturer software to monitor and cool your PC
Before installing a third-party tool, check whether your computer manufacturer already offers its own software. These applications often combine temperature monitoring, performance profiles, fan management and sometimes overclocking. The available options depend on the model, processor and BIOS.
Armoury Crate to monitor the temperatures of your ASUS PC
On ASUS ROG and TUF Gaming PCs, Armoury Crate monitors processor and GPU temperatures, fan speed and power consumption. It also offers profiles such as Silent, Performance and Turbo, as well as certain GPU and overclocking settings depending on the model.
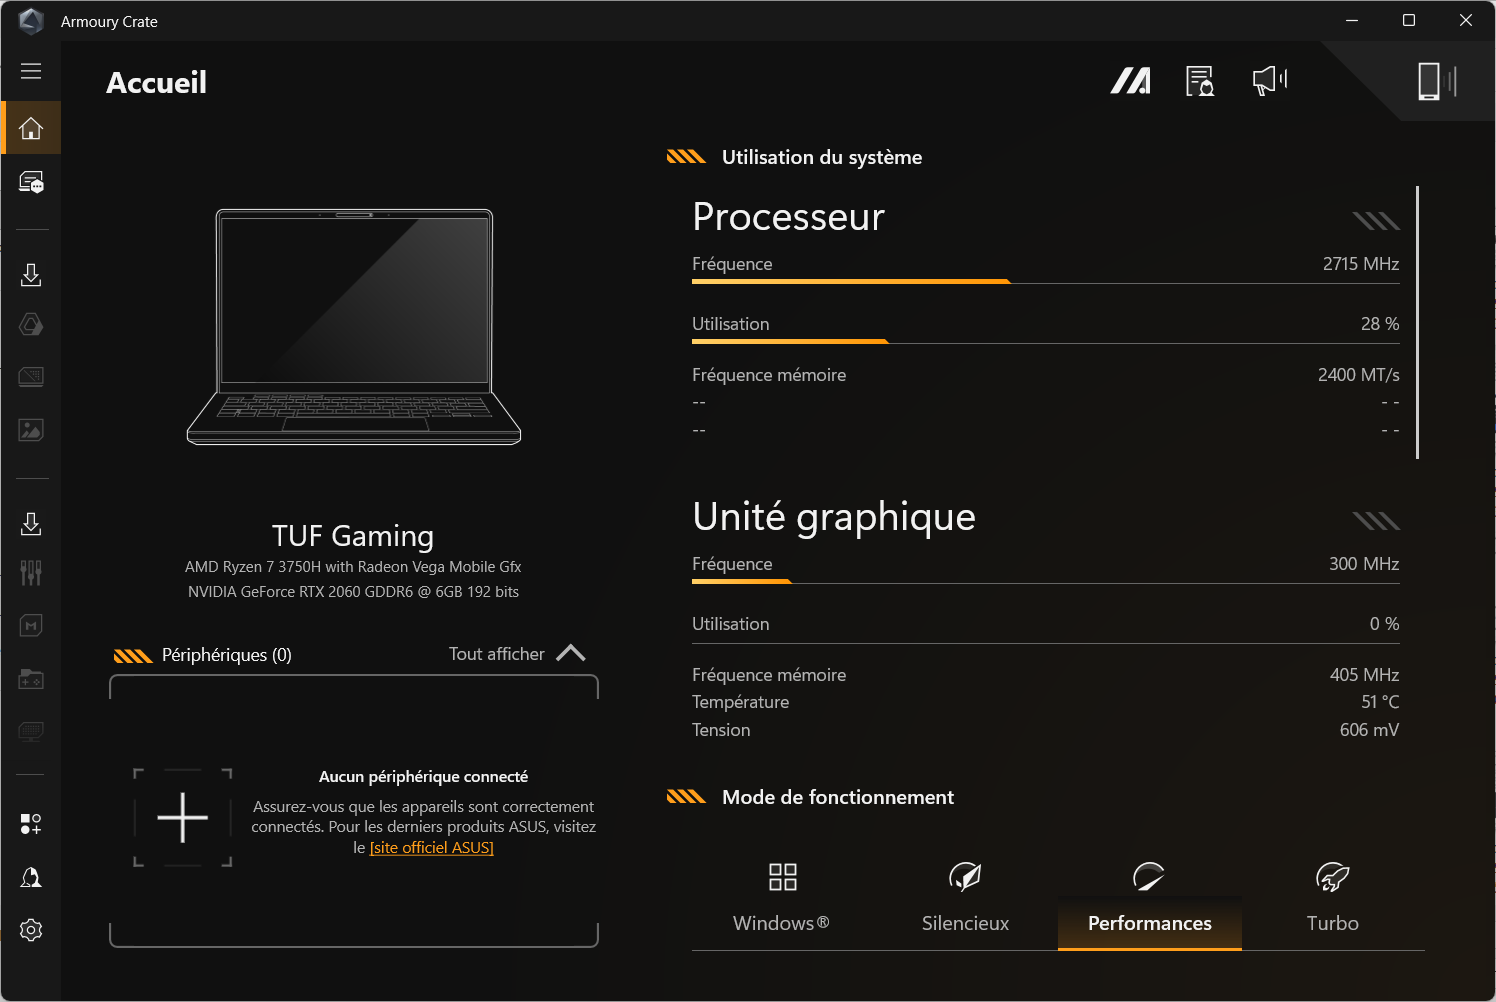
On standard ASUS laptops and ProArt machines, MyASUS instead centralizes diagnostics, operating modes and the available cooling settings.
HP OMEN Gaming Hub and HP Command Center
OMEN Gaming Hub is the reference tool for HP OMEN PCs and some Victus models. It displays temperatures, lets you choose a performance mode and can manage the fan curve or overclocking on compatible configurations. On other HP laptops, HP Command Center generally offers simpler thermal profiles, such as Silent, Balanced or Performance mode.
MyDell and Alienware Command Center
Alienware Command Center is designed for Alienware PCs and certain gaming-focused Dell computers. It lets you monitor the hardware, select performance profiles and adjust cooling. On other Dell PCs, MyDell or Dell Optimizer may offer thermal profiles and operating modes, but the available settings are more limited.
Lenovo Vantage and Legion Space
Lenovo Vantage lets you check the state of the machine and choose a thermal mode on many Lenovo laptops. Legion models also offer cooling and performance management features, and sometimes overclocking through Lenovo Vantage or Legion Space, depending on their generation.
PredatorSense and NitroSense
PredatorSense is installed on Acer Predator PCs and lets you monitor temperatures, choose a performance profile and control the fans. On Nitro models, NitroSense offers similar features with settings adapted to this range. These applications are particularly useful for checking that the selected cooling mode works correctly during a game.
MSI Center
MSI Center brings together monitoring and configuration features for MSI laptops. Depending on the model, it provides access to performance profiles, cooling modes, fan control and certain overclocking settings. Options may differ between the Raider, Vector, Stealth, Katana and other MSI series.
Gigabyte and Razer
Gigabyte Control Center, available on some Gigabyte and AORUS laptops, centralizes performance profiles, fan control and hardware monitoring. On compatible Razer Blade models, Razer Synapse also offers performance and thermal control modes. In all cases, use the profile recommended by the manufacturer before forcing maximum fan speed or overclocking.
If you prefer to check these temperatures without installing software, PowerShell, the BIOS/UEFI and Task Manager can do this. Our guide how to check your PC’s temperature without software explains the three methods and their limitations.
The content will unlock automatically after verification.