

A server that shuts down without leaving a trace in the logs, or a laptop whose fan runs at full speed during a simple task, may have a processor that is overheating. When temperatures rise too far, Linux automatically throttles performance to protect the hardware and can cut power if overheating continues.
To prevent crashes and diagnose the issue, read the data from your system’s thermal sensors. A few commands provide these figures in real time, whether you are using a desktop PC or connecting remotely over SSH.
Here are three ways to read and monitor CPU temperature on Linux.
In this article
Monitor temperature with lm_sensors from the command line
The lm_sensors utility is the standard way to query motherboard and processor sensors directly. It is lightweight and well suited to headless servers and quick terminal diagnostics.
Install lm_sensors on Ubuntu, Debian, Fedora, and Arch
Use the package manager for your distribution. On Debian or Ubuntu:
sudo apt-get install lm-sensors
On RHEL or Fedora:
sudo dnf install lm_sensors
On Arch Linux:
sudo pacman -S lm_sensors
Scan your hardware with sensors-detect
Once the package is installed, scan the hardware to identify monitoring chips:
sudo sensors-detect
The interactive script asks several technical questions. Accepting the automatic suggestions by pressing Enter is usually the simplest choice.
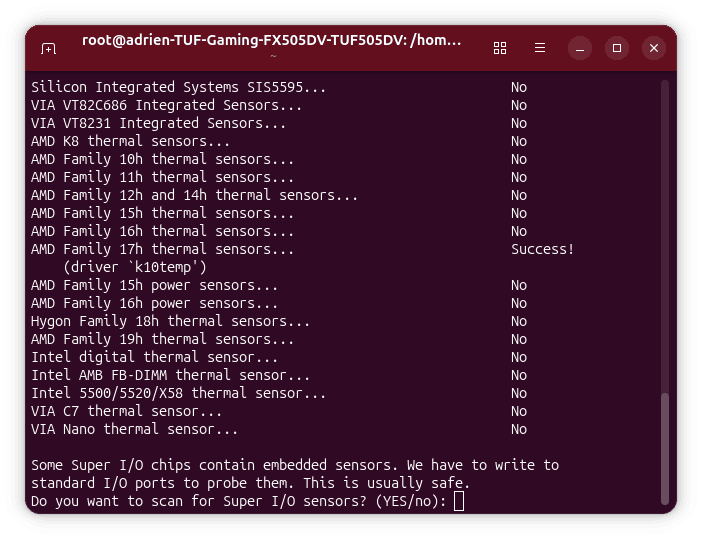
The program checks each sensor family and reports success when it finds a compatible driver. Accept the prompts so the system can load the required kernel modules.
Monitor CPU heat live with watch
When configuration is complete, display thermal data with:
sensors
The terminal shows current temperatures for each core and the manufacturer’s critical limits. To display Fahrenheit instead of Celsius:
sensors -f
During a load test, watch the temperature second by second:
watch sensors
The live view remains active until you press CTRL + C.
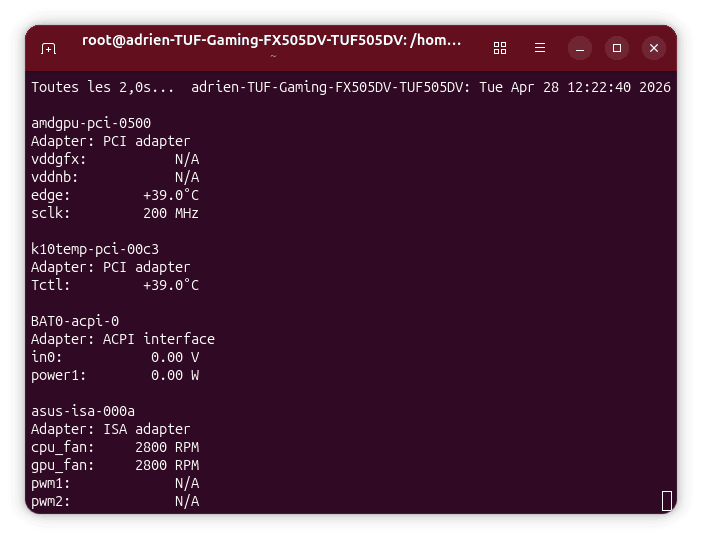
The terminal can also show graphics components, processor probes, fans, and CPU/GPU fan speed in RPM.
If temperatures are unusually high, learn how to cool down an overheating laptop quickly.
Don’t let the algorithm decide for you
Add Assistouest to your preferred sources on Google so you can find our guides faster when you search for an IT solution.
View your PC’s thermal status with Psensor
Psensor is a good alternative if you prefer a visual interface with real-time temperature graphs. Unlike lm_sensors, which is text-only, it centralizes monitoring for the processor, graphics card, and storage drives.
Install Psensor on the main Linux distributions
sudo apt update && sudo apt install psensor -y
On distributions that use dnf or yum, install it from the official repositories or with an external package:
sudo dnf install https://raw.githubusercontent.com/rpmsphere/x86_64/master/p/psensor-1.2.0-5.1.x86_64.rpm
Then launch Psensor from the GNOME, KDE, or XFCE application menu.
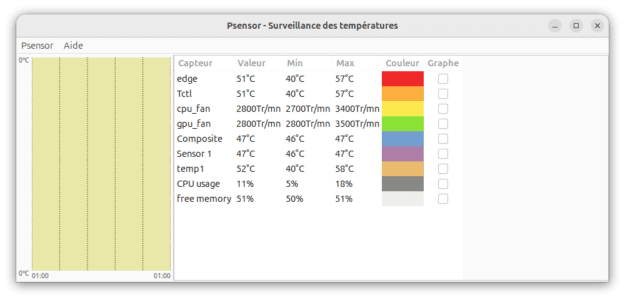
On its first launch, Psensor automatically identifies active sensors. Its preferences let you change graph colors and choose the statistics to display. You can also add an indicator to the desktop’s top bar so you can monitor temperature without leaving the main window open.
An error occurred. Please try again in a moment.